Now that we’ve covered a lot of ground in the qualitative space of investing, we’re good to start with the more quantitative side. On this occasion, we’ll be discussing income statements. No need to further introduce the subject given it’s quite straightforward, but before starting, a warning:
“If investing was all about studying financial statements, accountants would be the investors out there”
This doesn’t mean accountants are bad investors, but if the phrase was true, accountants would have the best returns among investors and this has never been the case.
Why is it important?
It is always a good practice to the very root of topics, even if that means to question its utility. Doing so, provides you with more rigid premises, which act as stronger land on which to stand on. A good set of premises can help you as an investor to more profoundly and accurately understand finance-related subjects and this can turn into an edge further down the road.
A valid analogy can be to think of a business as a person and to think of financials as the mechanism this person has to explain himself. Human society has invented language to express and explain sensations, processes and even thoughts. Now, imagine yourself trying to understand your peers without knowing English/Spanish, you wouldn’t be able to. Well, it’s similar in businesses.
To understand/explain a company’s underlying state, the created language was accountancy. Therefore, being capable of reading a company’s financials through accountancy knowledge can help you see the business true situation/condition and get a much less biased view of it. Particularly, it can help you:
Detect business fragility
Detect MOATs
Infer natural profitability
And many more things, which, added to knowledge on investing as a whole, can help you make better decisions on where to put your money. It always goes back to that. What an investor wants is to make the best decision on this regard, and this newsletter is for us to achieve it.
Income Statements
An income statement shows how a company has done during a certain period. Fiscally, the normal periods you’ll encounter will be Quarters and Years.
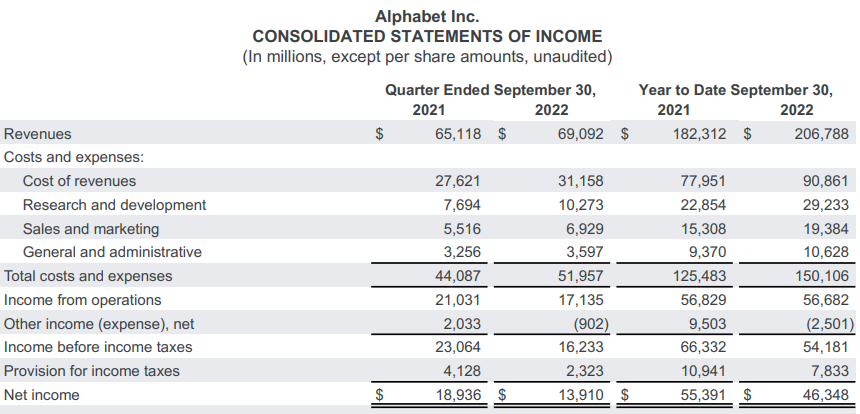
The importance of this section is that it allows an investor to take a closer look at the business’ actual operations and, upon them, conclusions or insights could arise. The selected metrics could vary from company to company, but the structure will always be the same, starting from revenue and ending with net income. Now, a brief description of each metric:
Revenue stands for the total/gross sales a company had in the respective period.
Cost of Revenues is the variable cost necessarily made to sell that particular volume of products/services. It represents the direct costs associated with the goods and services the company provided.
A line could be dropped below Cost of Revenues, and Gross Profit could appear (check the next Financial Statement). Gross Profit represents the money made by the business after subtracting the direct costs related to the occurred sales.
R&D is the money spent on investigation to innovate or develop a new line of products.
S&M is the complete process of bringing customers to buy a company’s products. It starts with creating awareness through marketing and, later concludes with the actual sales team convincing customers.
G&A are the ‘indirect’ expenses needed to run the business. Among them there’s salaries, rent, electricity bills, insurance, legal fees.
Another line can be dropped here (and in this case it is). Income from operations or operating income is the profit a business has made after deducting direct and indirect costs. It's a measurement of the operational profitability a business has.
Other Income (expense) is money made or lost by non-related business activities. An example could be foreign currency losses, interest expenses/income.
Provision for Income Taxes represents the period´s total income tax expense, which includes federal, state, local and foreign income taxes.
One last line can be drawn here, where we get to Net Income. This figure represents the benefits/earnings/utility a business has generated throughout the respective period, after all costs and expenses have been subtracted.
Now, to close this article, check this other financial statement. This one is from Mercado Libre’s Q3 2022. The importance here is that, no matter the difference in names of the metrics, they represent vaguely the same and the statement itself follows the same structure as Google’s.
Personal Commentary
I wanted to talk about cash flow statements, but the article was already long, so we keep the subject for a future one. These kinds of articles are fantastic in my opinion to learn, understand or even clarify concepts. Hope you enjoyed it!


