We’ve been lately exploring conceptual territory so I think it would be good for us to return to pragmatical things. Opposite to my normal articles, I’ll try to make this one as concise as possible, so every one of us can perform this task at least decently.
Looking for them
This is in some occasions actually difficult to find, but we’ll be covering 90% of cases. First, you’ve to type into Google “X investor relations” (we’ll be using Microsoft as an example).
Then you click the investor relation’s home page and, once in it, you’ll be seeing something like this (most pages are very similar). In here, you’ll notice there’s always some “earnings” or “financials” or something alike.
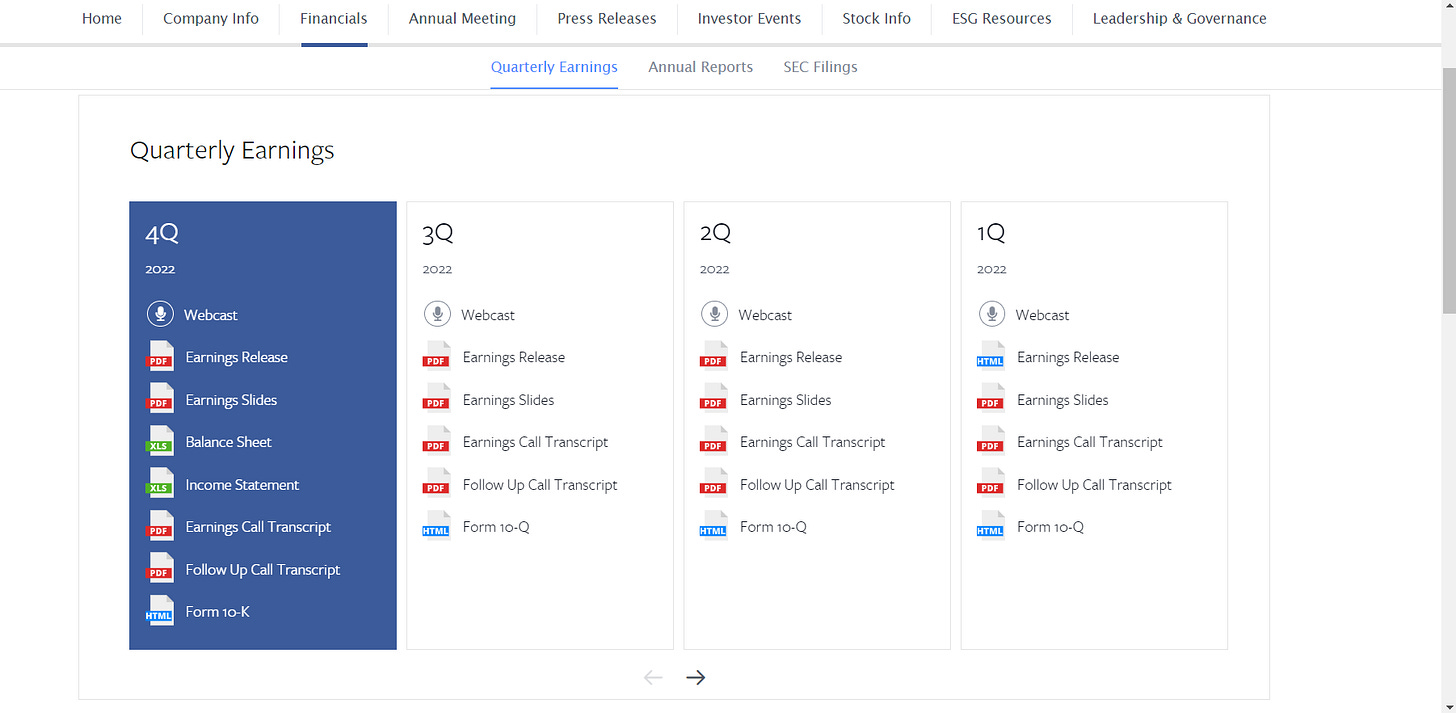
You click on it. Most companies tend to first publish their ‘Press Release’ in which they post their results in a short written format, but it’s also common for companies to directly upload results in quarterly results tables.
Anyway, you click on earnings results, then you’ll get to this:
Now it depends on the amount of time you have. I’ll cover from taking a brief overview to a somewhat profound analysis, moving up three levels.
Quick analysis (less than 5 mins)
To analyze a company’s quarterly results rapidly, stick to the press release, do not open other documents. You must know what to look for, which shall depend on the company you are researching and the context it’s immersed in. For instance, given the context today:
High growth SaaS: ARR and its growth, customer growth, retention rate, profitability (if improving FCF/OPM), SBC and other metrics you may find insightful.
Big company with multiple businesses like Microsoft: Overall financials (revenue, operating income, net income) and its YoY tendency, and look for particular business units you are interested in (you can ‘control f’ for LikedIn and Azure).
Traditional companies: Overall financial statements with particular emphasis on margins (given inflation) and CapEx.
You cannot perform a correct and rapid analysis if you do not know the company’s KPIs nor the industry or context it is in.
Moderate Analysis (10/20mins)
On this occasion, you will repeat the aforementioned process and add some extra steps. The reason for this is we are much more capable of absorbing information we already skimmed through.
After finishing your press release skim, you’ll check a bit in detail the three financial statements. Both tasks should take 10 minutes. Then, you’ll notice many companies report ‘slides’ or a ‘presentation’ in which they include visuals and stuff. There, you can go through what companies like to visually report. In such images, you’ll find very relevant information, but digesting them takes a bit more of time so it’s quite difficult to do all these in a quick analysis.
Somewhat Profound (30/60 mins)
Lastly, to perform the most decent earnings review (remember the goal is decency, not expertise or a crazy analysis) you’ll do the quick skim through the press release and then you’ll re-read it a bit more thoroughly. Lastly, in the press release you’ll dive a bit deeper into the financial statements. All that shall take around 15 minutes.
After that, you’ll go through the slides with precision, paying special attention to charts that represent the business’ KPIs. Now you are 25 minutes in. The last step to follow is to go through the company’s transcript (which is reported a few hours after the conference call). It usually is in the earnings section, in which most companies show something like a table. Microsoft is kind of unique in how simple it reports it. Here’s another example with Meta:
Transcripts do not have a typical length. They range from 10-30 pages, so the reading would take approximately 15/40 minutes, or less if you read it looking for particular information.
Personal Commentary
I hope you found today’s article useful. I think the numbers selected on how much time does each analysis take should be an ‘accurate approximation’. It is very important for us to review earnings results since they are the new unlocked pieces to our still un-finished puzzles.


