

Burford is not a ‘usual’ business, in the operating sense, and litigation claims are a novel asset class. Both elements might cause misjudgment when superficially analyzing the company’s reports. In this article, I’ll go over:
Everything related to Burford’s commitments and deployments.
How Burford’s portfolio value has evolved.
Portfolio diversification.
Management’s approach to unrealized gains.
Origination of New Business
Commitments impose the ceiling for near-term capital deployment. In 2010, the first full year of Burford’s operations, the company committed 102M dollars in capital. During 2022, commitments were in excess of 700M, on a Burford-only basis.
Burford also reports commitments made on a group-wide basis, which contemplates their asset management business as well. Since the acquisition of GKC in 2016, some balance sheet investments started to flow through the managed private funds. This dynamic brought temporarily down the percentage of capital provision-direct commitments as a % of total.

Another implication is that it becomes obvious that not all balance sheet capital is deployed in core legal finance. Part of it has been, in the past, invested through the Strategic Value Fund and the Advantage Fund. The former is focused on complex strategies, though Burford has directly invested in some of these as well, while the latter on pre-settlement litigation. The following image displays Burford’s balance sheet investments in the different assets utilizing 2018 as an example.

Burford mentioned in their 2023 annual report that the Strategic Value fund was closed. Hereafter, complex strategies investments would be done directly on the balance sheet. Similarly, a successor for the Advantage Fund is unlikely to come. Management stated that pre-settlement investments that meet desired hurdle rates will be taken on the balance sheet as well.
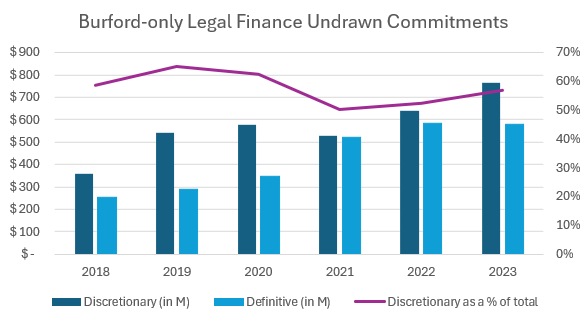
Undrawn commitments represent the company’s commitments where capital hasn’t been deployed yet. Burford finished 2023 with 1.408bn in undrawn commitments on a Burford-only basis. In the previous year, undrawn commitments were at 1.307bn, out of which 75M were in legal risk. Legal risk undrawn commitments declined to 49M in 2023.
Discretionary undrawn commitments as a percentage of total were 57% at the end of 2023. The share is expected to be volatile period over period. Notwithstanding this, Burford is largely in control of their deployments due to most being discretionary. On the flipside, definitive commitments tend to be longer-term and have an associated timetable indicating when will Burford deploy the capital. This gives room for management to efficiently manage cash.
Burford’s capital deployments have also rapidly escalated throughout the past 15 years. What we tend to observe is that deployments have a certain lag with respect to commitments. In contrast to the latter, indirect capital-provision deployments as a percentage of total shows a stronger decline. I suspect this is due to management’s thesis for acquiring GKC. Essentially, they noticed there were multiple attractive assets in the broader legal finance spectrum, some of which might have presented more attractive IRRs than core legal finance. I suspect the team biased deployments on that end because of that and, now that they have yielded the returns on the “obvious” investments, deployments in core legal finance again dominate. There’s a further element of management’s increased focus on balance sheet investments, wherein I’ll focus in a future write-up.

Historically, as of 2022, Burford had deployed 42% of committed capital in the first year after the commitment was made. The percentage deployed increased to 70% after three years. In total, Burford has deployed 85-90% of capital committed to concluded matters, both partially and fully. The following image illustrates average deployments on commitments made for each vintage from inception until 2019.

Deployments of committed capital have been more gradually evolving. Initially, it appears as if capital was more rapidly deployed, whereas capital deployed in more recent vintages’ commitments has been less abrupt. I’m inclined to suspect this is due to a mix of the following: (i) average commitment size increasing might cause management to act more slowly in this regard; (ii) although not disclosed until 2018, I believe commitment size increasing leads to definitive commitments increasing their share of total, hence associating a larger base of commitments to schedules; (iii) as commitment size increased, management’s expectations on the WAL of specific investments might have increased as well, giving more expected time for deployment; (iv) portfolio of claims should tend to encompass claims with no urgent capital requirements; (v) larger underwriting implies more exposure to settlements, which do not allow for full deployments.
As a partial consequence of delayed deployment after commitments, and a growing business, undrawn commitments have been gradually increasing as well. Burford reported in 2023 that deployments on undrawn commitments had a “median over the last five years of 18% at prior period end funded in the following 12 months.” That is, if Burford ended a year with 1bn in undrawn commitments, for example, 18% of that capital, or 180M, would be deployed in the subsequent one, considering it fell on the median level.
This is a metric that started being reported in 2019 and remained fairly stable. It’s worth highlighting that Burford’s business can be very volatile from period to period. In 2017, they deployed 30% of undrawn commitments from 2016 year-end. In 2019, 12% of undrawn commitments were deployed.
Burford-only Portfolio Value
Burford considers the value of its portfolio to be equal to: deployed cost + fair value adjustments + undrawn commitments. I find the latter to be somewhat misleading. The company will not necessarily deploy the completeness of undrawn commitments and, even under such eventuality, it might make more sense for it to be part of the portfolio’s value after deployment. Nonetheless, it’s useful to think of these as highly likely future deployed cost.
For YPF-related assets have been a hugely contributing factor to Burford’s portfolio growth, I opted to separate the two. Since 2009, the company’s portfolio has grown from less than 100 million dollars to a total of 4.84bn as of 2023 year-end.
The carrying value of YPF assets was estimated and reported at 1.37bn on a Burford-only basis, meaning these equate to 28% of Burford-only portfolio value. Deployed cost on YPF was reported at 60M in 2023, hence the majority of the carrying value is composed of unrealized gains.

Total fair value adjustments amount to 1.81bn dollars, with YPF being 72% of the total. In 2023, Burford reported an unrealized gain of 542.9M on their YPF-related assets, leaving ex-YPF fair value adjustments at 154M for the year. Total fair value adjustments represent 38% of Burford-only portfolio value. Undrawn commitments and deployed cost were 1.39bn and 1.57bn, or 29% and 33% of the portfolio value, respectively.

Portfolio Diversification
Though Burford tended to mainly focus on law firms, relationships with corporations have massively grown after legal finance becoming a more widely known financial tool. In 2023, Burford had 55% of its commitments done to corporations and 41% to law firms on a group-wide basis.

The last time Burford cleanly broke down their group-wide capital provision-direct portfolio was 2021, wherein deployed cost and undrawn commitments are considered. On a case-type basis, the top 3 made up for 63% of the portfolio’s value. Measured by industry, “other” and “mixed” represented 65% of the portfolio.

On a similar note, their geographical and currency exposure was shared. The vast majority of their exposure is from North America and Europe, with the USD being the currency in which Burford mostly structures their deals.

Finally, Burford included their largest related exposure on a Burford-only basis, ex-YPF, in their 2021 Investor Presentation. The largest of them amounted to 9% of the portfolio’s value.

What I suspect is a fair conclusion from my prior remarks is that Burford’s operations are widely diversified in all respects. This is an element that should not be overlooked. Uncorrelation of returns are more easily attainable when there are no clear commonalities between underlying litigation cases. Although courts allegedly behave in an idiosyncratic manner, I find it more comforting to observe the fact that chances for human biases are lower.
Unrealized Gains
Legal claims being a new asset class has caused some difficulties concerning the method for valuation. The investment community has manifested skepticism towards Burford’s portfolio intrinsic value. Management has historically employed a somewhat conservative approach in this regard, though it’s hard to visualize at a first glance. YPF-related assets gained a great share of Burford-only portfolio’s carrying value since 2019 due to unrealized gains.
With the objective of analyzing the conservativeness of the mechanism utilized, I charted Burford’s carrying value excluding YPF-related assets. I found that over 80% of Burford’s carrying value has been systematically composed of deployed cost, excepting 2023.
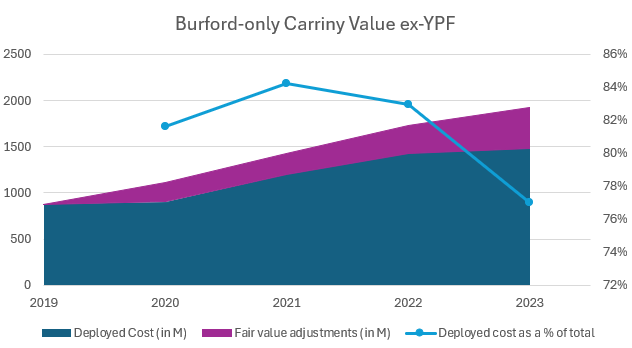
This means that management are not focused on playing accountancy tricks. Given the perceived mystery still involved in legal finance, there exists a possibility of exploiting accountancy. Muddy Waters report tried to show some of these dynamics in 2019. However, valuing assets mostly at cost does not appear as extravagant to my eyes.
Further, the high returns on capital Burford has had, mixed with consistently valuing assets as mostly their cost, means that management mostly realizes gains once assets reach maturity. The following image displays the moments in time when Burford generally does fair value adjustments.

There is an interesting case study Burford provided to better visualize how a process like this might look in real time. The chronology of key case events was as follows (quote from FY21 presentation):
2013-2014: Burford deploys $2 million. Case held at cost until motion to dismiss rejected by the court, causing fair value gain of $370,000
2015: Further deployments of $1.9 million as case proceeds through discovery. Additional deployments held at cost.
2016: Further deployments of $4.5 million through trial. Case loses at trial and matter written down to zero.
2017-18: Appeal of trial verdict pursued with additional funding of $0.1 million. A parallel case was reversed making reversal in this case very likely and fair value moved from zero to $1.9 million.
2019: Appellate court reverses verdict, reinstates claims and sends case back to trial court. Carrying value returned to deployed cost. Additional deployments of $0.8 million.
2020: Further deployments of $1.1 million as trial court hears renewed summary judgment motions – results are favorable to claimant, giving rise to $6.1 million fair value gain.
2021: Case is trial ready, but new Covid-19-era rules requires mediation for cases to be calendared for trial – at mediation, parties agree to settlement of which Burford is entitled to $36 million, generating net realized gain of $25.1 million.

Personal Commentary
My last, for now, research article on Burford will be on their fair value methodology. It will then be followed by a 2023 performance review and a one-pager. The next company I’ll cover, though in not much depth is, I suspect, Winmark.